
| Sample 9 FIT in a nutshell |
SYSTEM(Run=1) ! it is best to "Step" thru this script the first time (hit Cancel in MSG dialog)
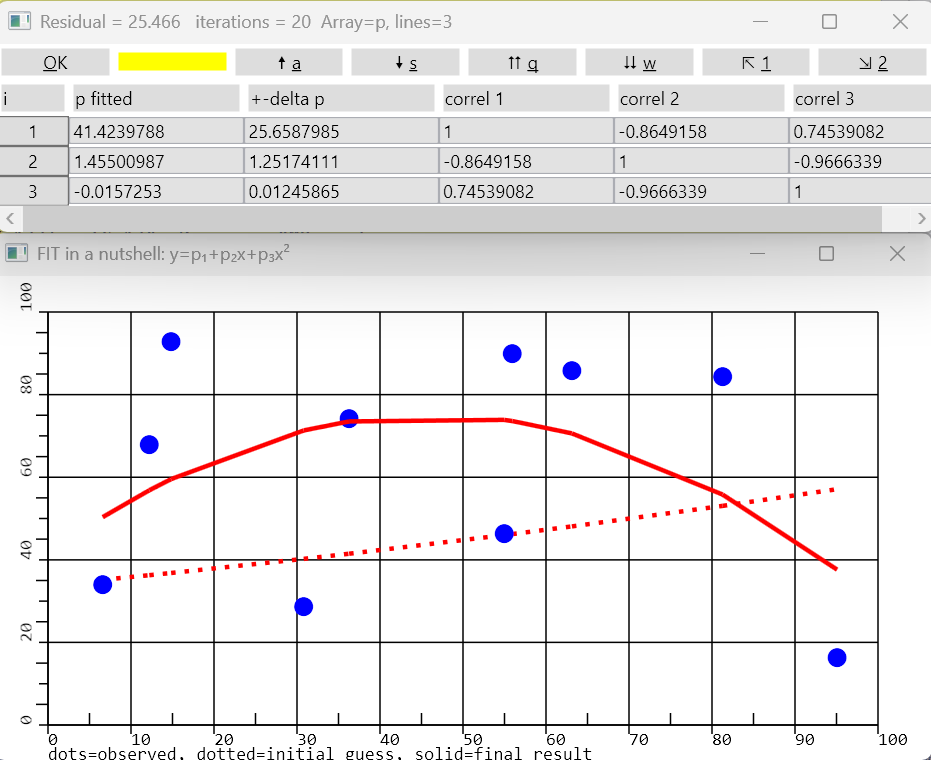
MSG(T='This script will fit random observed data to|y=p₁+p₂x+p₃x²|OK will repeat this|More in FIT.hic')
p($,1) = (1, 0.1, 0.01) ! = initial guess. P-columns: pStart/Result, deltap, correlations(number of parameters)
DO
SET(xmc=(10,3), p=(3,5)) ! "calculated" y will go to column 3 of xmc
xmc($,1) = 10*$ - RAN(10, 9) ! "observed x values"
xmc($,2) = RAN(50,45) ! "observed y values" = random(50 +- 45)
. get yCalculated = xmc($,3) (column 3 of xmc: initial guess with current parameters p)
XEQ("xmc($,3)=p(1,1)+(p(2,1)+p(3,1)*xmc($,1))*xmc($,1)")
. prepare the graph:
DLG(TI='FIT in a nutshell: y=p₁+p₂x+p₃x²', rows=2,cols=2, AX=4, TI='dots=observed, dotted=initial guess, solid=final result')
. plot observations (blue dots) and initial guess (red, dotted):
LINE(AX=4, OneWayX=1, Col=1,XV=xmc, Col=2,YVec=xmc,Symb='⚫', D=-9, Col=3,YVec=xmc,Wid=3,Symb=' ', Broken=1.2, D=900)
. fit polynom to observations:
iterations = FIT(Residual=res, Theory="xmc($,3)=p(1,1)+(p(2,1)+p(3,1)*xmc($,1))*xmc($,1)", Parms=p, XMY=xmc)
. plot the fit result (red):
LINE(AXis=4, OneWayX=1, Column=1,XVec=xmc, Col=3,YVec=xmc,Width=6,Symb=' ', Draw=900)
. ! show result numerically:
DLG(TI=res, L=0, W=1/2, Array=p, TI='i,p fitted,+-delta p,correl 1,correl 2,correl 3,')
ENDDO